AI in radiology and a reduction of interobserver variability in assessing patient response
Interobserver variability and intraobserver variability are terms commonly used in the context of medical image analysis and diagnostic interpretation, particularly among radiologists and other medical professionals. They both refer to the consistency and reliability of observations and interpretations made by different observers or by the same observer over time, respectively. Also, both types of variability are essential considerations in the assessment of the reliability and accuracy of medical image analysis and diagnostic processes.
It has been shown that computer-aided diagnostic tools can assist radiologists in their work, potentially reducing variability and increasing consistency. But how objective, reliable, and consistent can AI-enabled applications be when analyzing the same patient response over time? We did some tests.
Is the interobserver variability in manual delineations for different structures and observers really that large among radiologists?
Intraobserver variability, also known as intra-rater variability, refers to the degree of inconsistency in observations made by the same observer when presented with the same data on separate occasions. On the contrary – interobserver variability, also known as interrater, refers to the degree of variation in interpretations made by different observers when presented with the same set of data. These variances can introduce uncertainty, errors, and inconsistencies in the interpretation of medical images and patient data, potentially affecting patient care and treatment decisions. What numbers are we talking about?
According to research conducted by Joskowicz et al. ‘the mean volume overlap variability values and ranges (in %) between the delineations of two observers were:
- liver tumors 17.8 [-5.8,+7.2]%,
- lung tumors 20.8 [-8.8,+10.2]%,
- kidney contours 8.8 [-0.8,+1.2]%
- and brain hematomas 18 [-6.0,+6.0]%.
For any two randomly selected observers, the mean delineation volume overlap variability was 5–57%’ [1]. Moreover, estimates suggest that, in radiology in some areas, there may be up to a 30% miss rate and an equally high false positive rate [2].
The numbers speak for themselves.
Consistent assessment of patient response
Even the slightest variability can potentially affect patient care and treatment decisions, not to mention the drug discovery and development pipeline. Accurate and consistent assessment of disease progression or response is critical in clinical trials. Interobserver variability can introduce noise into trial results, lowering the reliability of conclusions about new treatment efficacy. It is not only about the accuracy of measurements, but also about the consistency. Inconsistencies in evaluating patients can lead to inconsistencies in categorizing their responses (complete response, partial response, stable disease, or progressive disease). Furthermore: it can result in misclassification of patients’ actual responses to treatment, lowering the statistical power of the study, affecting the accuracy of endpoint measurements, introducing data harmonization challenges, or even calling the data’s reliability into question. Eventually, in the worst-case scenario, disagreements among different radiologists can even lead to delays in decision-making regarding treatment modifications or trial continuation. Human mistakes happen, but it’s important to minimize them. So, at that point, it’s meaningful to ask the question here: Can AI assist in this variability reduction?
AI algorithm for measuring patient response in evaluation exams
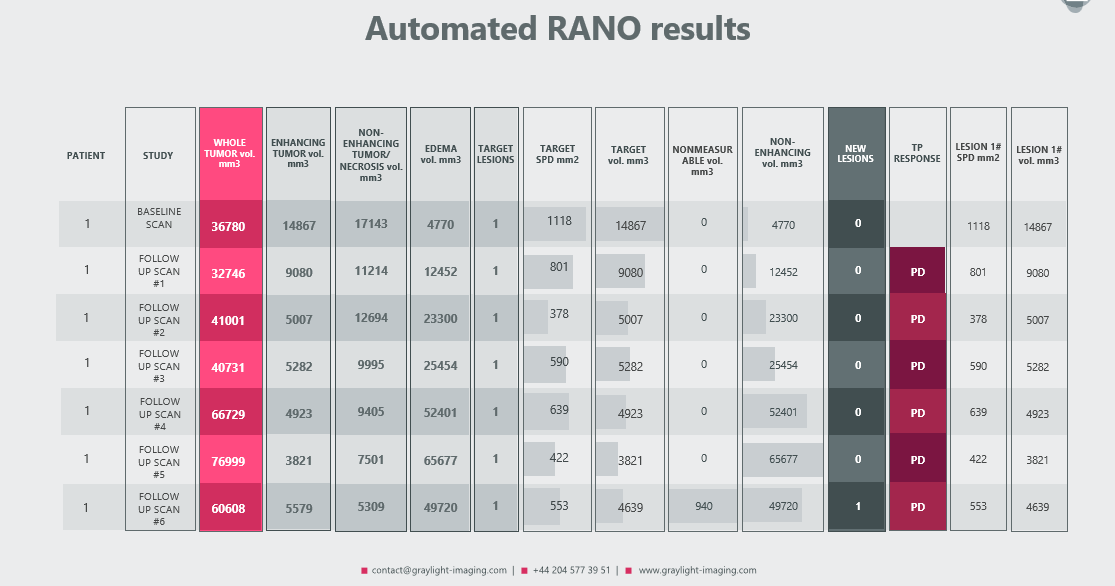
In a recent post we presented our automated RANO (and RECIST) algorithm, which can handle measurements for even small tumors with a great accuracy [3]. Because its primary goal was not only to automate measurements and assist radiologists in calculating volumes for each region of a brain tumor, but also to provide a more sensitive assessment of the patient’s response – its functionalities may evolve.
As a result of such modification, the following automated measurements were added to the traditional radiologic report:
- treatment response
- detection of new tumors
- RANO and volumetric measurements for each target lesion, allowing for precise comparisons at each control visit
- volumetric measurement of tumors classified as ‘nonmeasurable’ according to the RANO criteria

Data credit:
https://wiki.cancerimagingarchive.net/pages/viewpage.action?pageId=133073470
Data citation:
Zolotova, S. V., Golanov, A. V., Pronin, I. N., Dalechina, A. V., Nikolaeva, A. A., Belyashova, A. S., Usachev, D. Y., Kondrateva, E. A., Druzhinina, P. V., Shirokikh, B. N., Saparov, T. N., Belyaev, M. G., & Kurmukov, A. I. (2023). Burdenko’s Glioblastoma Progression Dataset (Burdenko-GBM-Progression) (Version 1) [Data set]. The Cancer Imaging Archive. https://doi.org/10.7937/E1QP-D183
TCIA Citation
Clark, K., Vendt, B., Smith, K., Freymann, J., Kirby, J., Koppel, P., Moore, S., Phillips, S., Maffitt, D., Pringle, M., Tarbox, L., & Prior, F. (2013). The Cancer Imaging Archive (TCIA): Maintaining and Operating a Public Information Repository. In Journal of Digital Imaging (Vol. 26, Issue 6, pp. 1045–1057). Springer Science and Business Media LLC. https://doi.org/10.1007/s10278-013-9622-7
Abbreviations:
CR – complete response
ET – enhancing tumor
Non-ET – non-enhancing tumor
NonM – nonmeasurable
PD – progressive disease
SPD – sum of product diameters (RANO)
TL – target lesions
TP – treatment response
The outcomes achieved through the utilization of this algorithm have yielded highly meaningful data. If you believe that a similar approach could be beneficial to your research or medical endeavors, please do not hesitate to reach out and contact us. We are eager to collaborate and share our expertise to advance the field further.
References:
[1] Joskowicz, L., Cohen, D., Caplan, N. et al. Inter-observer variability of manual contour delineation of structures in CT. Eur Radiol 29, 1391–1399 (2019). https://doi.org/10.1007/s00330-018-5695-5
[2] Krupinski EA. Current perspectives in medical image perception. Atten Percept Psychophys. 2010 Jul;72(5):1205-17. https://doi:10.3758/APP.72.5.1205. PMID: 20601701; PMCID: PMC3881280.
[3] https://graylight-imaging.com/automated-rano-and-automated-recist-algorithms-at-your-service/