Liver and liver tumor segmentation and analysis algorithms
We can create bespoke automated and semi-automated algorithms for both liver and liver tumor segmentation and analysis based on your specific requirements. We present our models for liver and liver tumors segmentation based on portal venous CT scans. Including primary tumors, secondary tumors and metastases.
Our work: AI algorithm for liver tumor segmentation
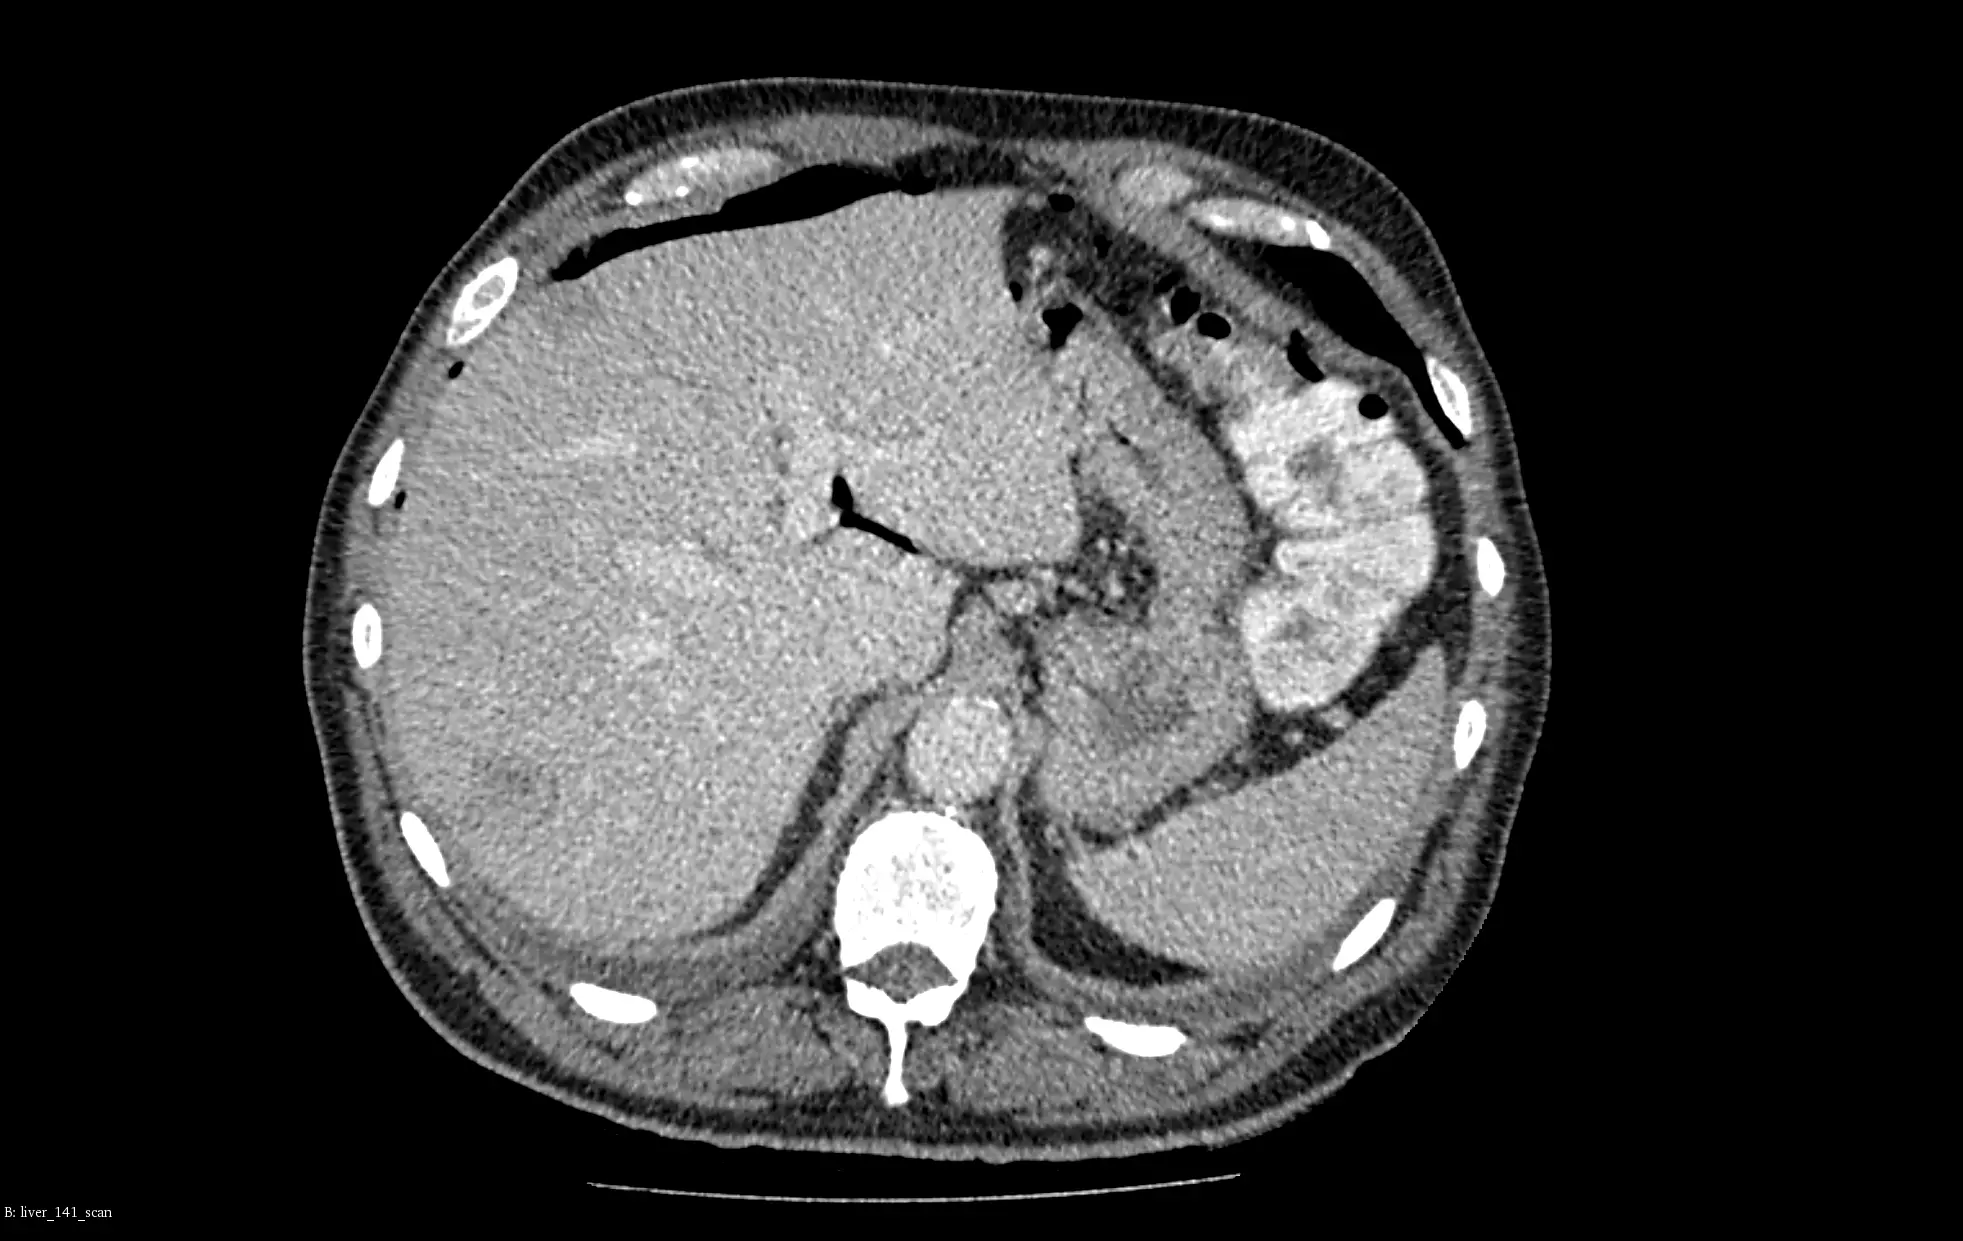
In the example below, we depict how our models work for a patient from the LiTS2017 test set (not used for training). Markedly emphasize that our algorithms automatically perform volume and RECIST measurements of the tumors. Moreover, using a function with an option to extend it to mRECIST the model make these measurements, if proper training data are available. What’s more, it can be a useful tool for monitoring patients in clinical studies.
Training dataset for AI model
We have trained our liver segmentation model on a dataset of more than 500 patients. Its results were used to extract the region of interest for tumors segmentation. Our tumor segmentation model is now the top best solution regarding average Dice (0.77) on LiTS2017 Challenge Open Leaderboard. The liver segmentation model provides very accurate results with an average Dice of 0.954 on LiTS2017 test data.
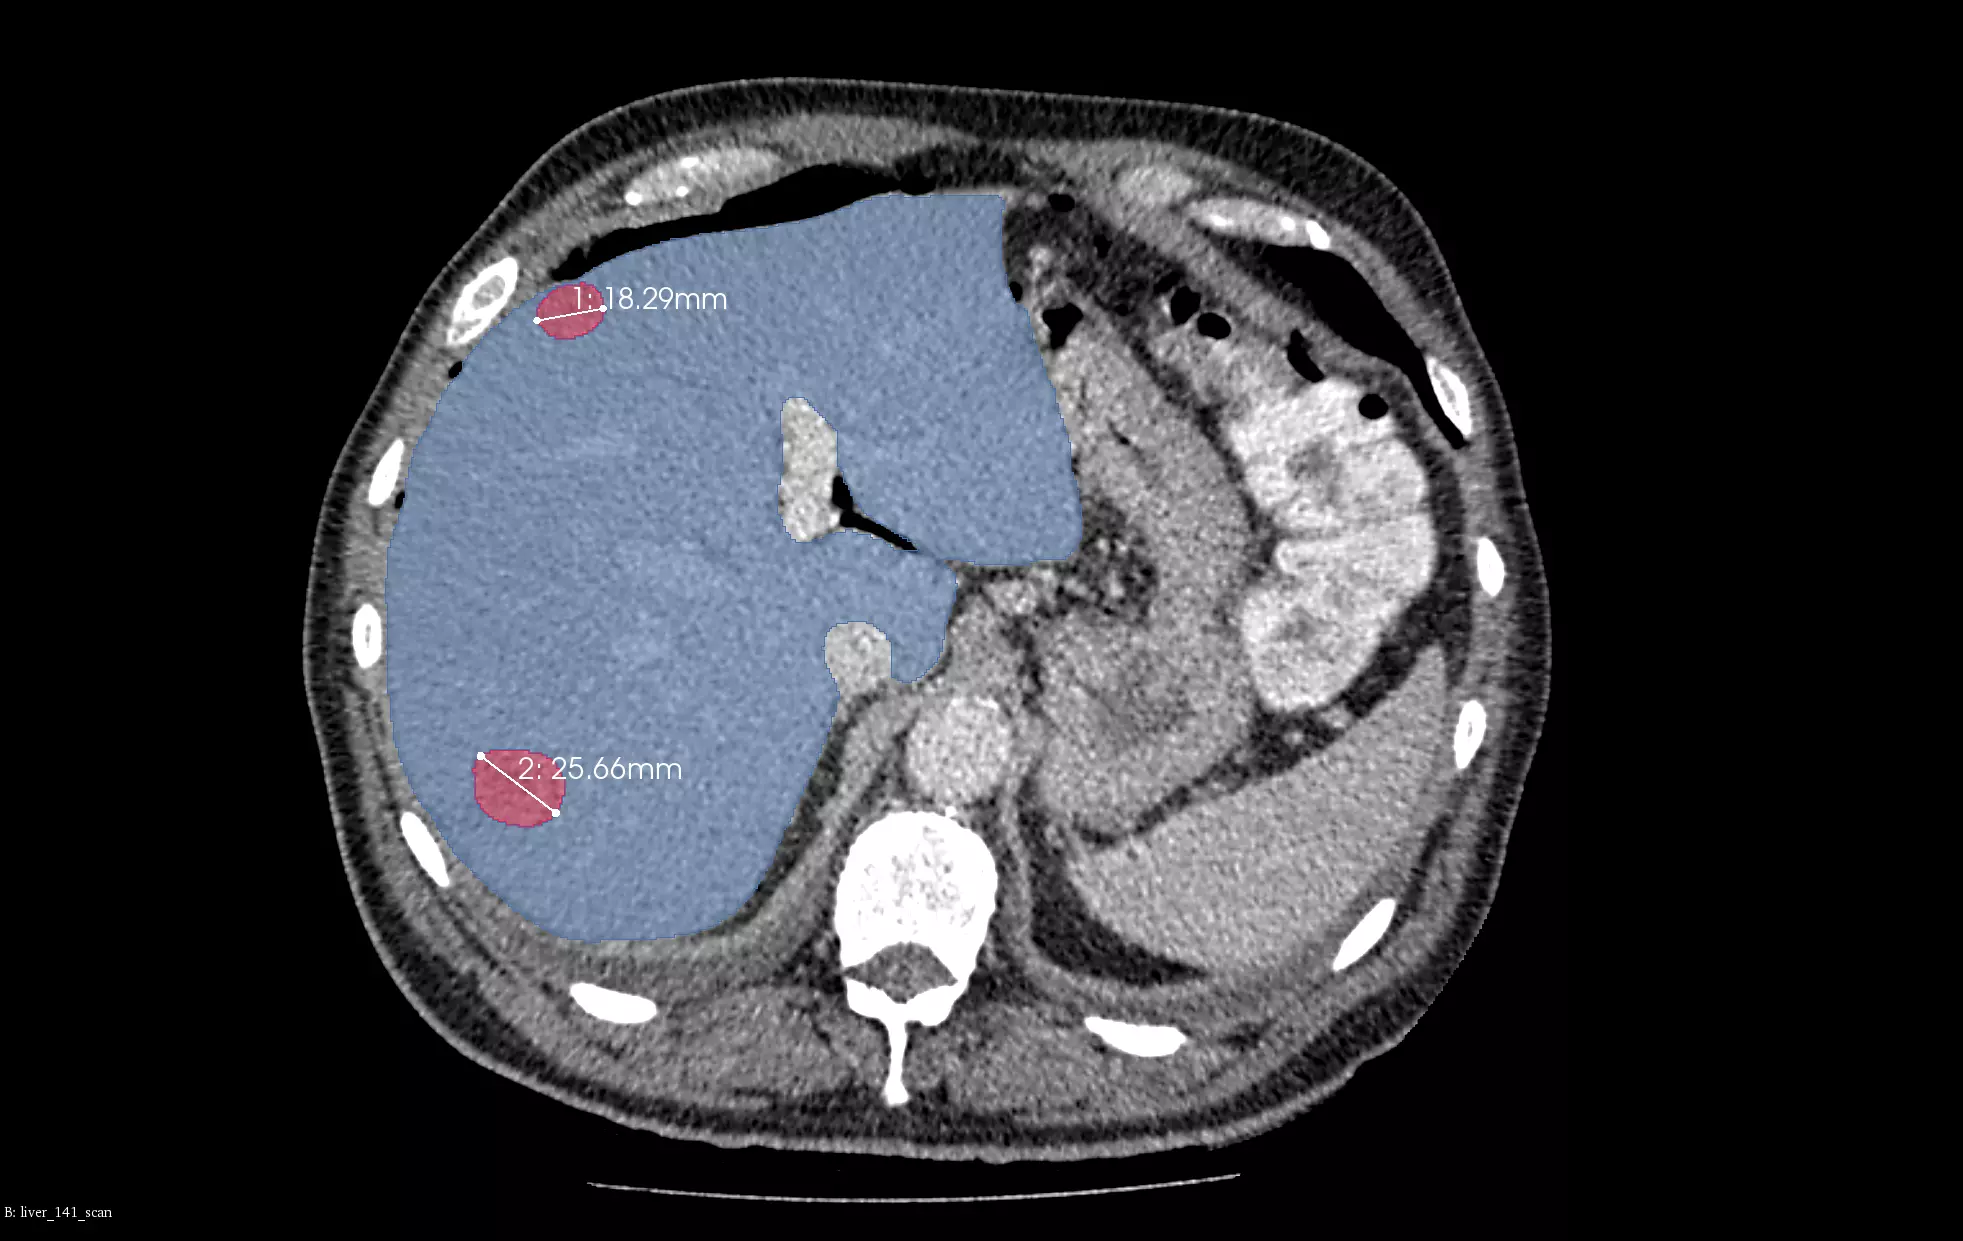
Visualization: our algorithms work results
- Blue colour means: the liver segmentation
- Red colour means: the tumor segmentation
- White colour means: the RECIST measurements
- The models identified 4 measurable tumors with longest diameters of 26 mm, 18 mm, 16 mm, and 10 mm, and with corresponding volumes of 9 ml, 2.3 ml, 0.7 ml, 0.6 ml. For clarity, on the visualization we can see only two biggest lesions.


Our algorithms for segmentation
Graylight Imaging’s machine learning technologies automate the segmentation procedure.Our models were able to identify and locate features within organs on a variety of examination types, as well as outline the organs themselves.
Quantitative data extraction and quantification from medical pictures
In summary, these algorithms provide valuable quantitative data and can be used for measurement and analysis. They are able to identify any abnormalities in any internal anatomical structure within a single patient.
By using RANO and RECIST criteria (automated RANO and automated RECIST) to real data, we developed and implemented fully automated algorithms for accurate and thorough patient response measures. Moreover, beyond what the rules recommend, our technology is far more advanced.