Automated Medical Image Analysis using AI: The Why, The How, and The What
By: Jakub Nalepa Ph.D. D.Sc.
We’ve been witnessing an unprecedented level of success achieved by artificial intelligence (AI)-powered techniques in virtually all fields of science and industry, with automated medical image analysis not being an exception. Thanks to the availability of high-performance hardware and a variety of software tools, benefiting from the recent advances in classical machine learning and deep learning has become easier than ever. It opened new doors for the deployment of such approaches in clinical settings. This may raise expectations and make us believe that AI would solve all problems that clinicians face daily. Although we’re still far from this point, there are indeed tasks that may be automated using data-driven algorithms. They range from improving the clinical workflow through automating scheduling, enhancing the quality of medical images, their registration, segmentation, and classification, straight to radiomics, being the process of transforming image data into mineable and quantifiable features [1].
Automated medical image analysis: why do we need automation?
Undoubtedly, medical image analysis is one of the most important tasks performed by radiologists. Accurate delineation of abnormal tissue can be key in defining the treatment pathway, as it could be one of the factors that enables us to quantify and monitor the patient’s response. Assume that we want to understand what the volumetric characteristics of a brain tumor in a longitudinal study were. In this study, a patient was repeatedly scanned. Secondly, human readers manually delineated several MRI scans. Ideally, an observed decrease of the tumor’s volume in the subsequent time points would mean that things go well. However, this decrease can easily result from poor reproducibility. Not to mention intra- or inter-rater variability inherently related to manual image analysis. Things may get even more challenging if we look at the three-dimensional analysis of full scans [4].
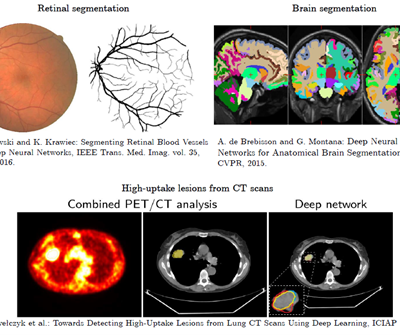
Here AI comes into play – in many different scenarios (Fig. 1).

Figure 1
How can we automate brain tumor segmentation from MRI?
There exist quite a number of medical image modalities – let’s focus on MRI that plays a key role in modern cancer care because it allows us to non-invasively diagnose a patient, determine the cancer stage, monitor the treatment, assess, and quantify its results, and understand its potential side effects in practically all organs. MRI may be exploited to better understand both structural and functional characteristics of the tissue [2] – such detailed and clinically-relevant analysis of an imaged tumor can help design more personalized treatment pathways, and ultimately lead to a better patient care. Additionally, MRI does not use damaging ionizing radiation, and may be utilized to acquire images in different planes and orientations. Thus, MRI is the investigative tool of choice for neurological cancers for brain tumors [3].
Different approaches for brain tumor segmentation
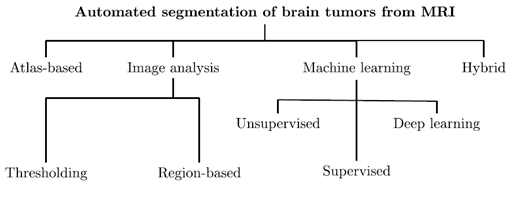
We may split the approaches for brain tumor segmentation into four main categories. These will be the atlas-, image analysis- and ML-based techniques, and those which hybridize various algorithms belonging to other groups (Fig. 2). Obviously, this taxonomy clearly shows that the topic is very active in the literature. Additionally, new algorithms for this task continuously emerge.

Fig. 2: Brain tumors can be automatically segmented using a range of different algorithms.
This figure is inspired by our previous work [6].
Automated medical image analysis: tumors and healthy tissue
There are, obviously, important challenges that we need to face if we want to benefit from classical ML or deep learning for brain tumor segmentation. In the former approaches, we have to design appropriate extractors that enable us to capture discriminative image features. These, in turn, should allow for distinguishing tumorous and healthy tissue. Commonly, such extractors elaborate a variety of features to reflect the tissue characteristics as best as possible. Obviously, we may quantify the distributions of the voxels’ intensity. What’s more, we can also capture characteristics that are not visible to the naked eye, e.g. texture. There is no doubt that designing effective extractors is not a piece of cake at all and it may be human-dependent. Deep learning helps us tackle this issue. Such models (of a multitude of various architectures) exploit automated representation learning. That means that feature extractors are automatically elaborated during the training process.
How to generalize well over unseen image data?
Sounds like the way to go? Indeed, deep learning has established the state of the art in brain tumor segmentation (see the Brain Tumor Segmentation Challenge organized yearly at MICCAI). However, the high-capacity learners require huge amounts of data to learn from, if we employ supervised learning. We want to be able to accurately segment MRIs of varying quality and captured using different scanners, don’t we? That means we want to be able to generalize well over unseen image data. Supervised learning for tumors is like teaching a student. We show the AI clear examples of tumors and healthy tissue, just like showing pictures in class. This helps the AI understand what’s important (tumor signs) and what’s not (irrelevant details).
How to generalize well over unseen image data?
Unfortunately, the world is not fully labelled – we need to somehow generate ground-truth labels. Remember intra- and inter-rater variability? This is just one issue that makes the manual annotation process challenging. Besides, it is costly, time-consuming, and not super exciting… Fortunately, we can try to synthesize artificial examples based on existing training samples in the data augmentation process. Even very simple operations may lead to an increase in the training size considerably (Fig. 3).

Figure 3 [8]
Right, now we have a dataset prepared to be fed into the training process of our carefully selected and designed AI model. Are we ready to hit the market with brand new ground-breaking medical image analysis software? Fortunately, not yet. To be able to deploy the AI algorithm in the wild, we must prove that it has been designed, verified, and validated with care.
Automation yes, but safety first
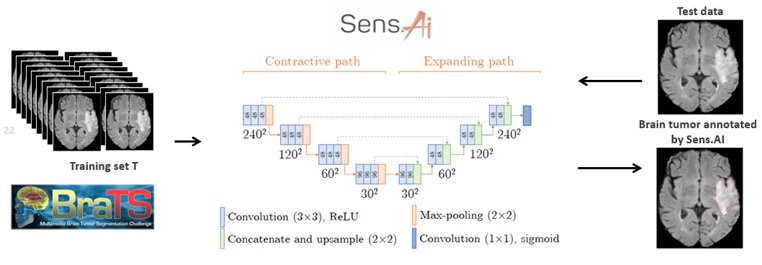
We’ve been driving down this very route with Sens.AI – the automated tool for segmenting low- and high-grade gliomas from FLAIR MRI. Such software must be CE-marked to be deployable in clinical settings (or FDA-cleared in the US). You must manage the risk, prepare documentation, and validate it. We can’t just throw any data at the algorithm! For training to work, we need high-quality examples that effectively teach the algorithm how to operate. The heart of Sens.AI is the U-Net-based deep neural network – this architecture is used for both brain extraction (the process of removing the skull from input FLAIR MRI images), and for delineating tumors. After training and setting up the processing system, we can test it on new data, like scans from your local hospital. Here’s hoping it works like a charm! (Fig. 4). Can you quantify our hopes though?

Figure 4 [6].
Quantifying the performance of the AI model
As we already know, delivering high-quality ground-truth segmentation is an expensive process which may lead to biased tumor delineations. Besides, such gold- (or silver-) standard segmentations are rarely available for clinical data. Isn’t it tricky to quantify the performance of our segmentation technique then? What if we want to use a standard overlap metric, e.g., the DICE coefficient, to compare the predicted and manual (ground-truth) segmentation, and the ground truth is incorrect? Can the model deliver a higher-quality delineation than the ground truth?
Combining quantitative, qualitative, and statistical analysis
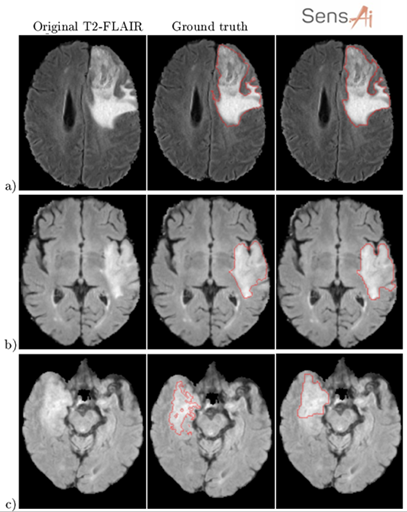
We tackled those issues by combining quantitative, qualitative, and statistical analysis in our validation process. On the one hand, we calculated and analyzed classical quality metrics. Moreover, we performed the mean opinion score (MOS) experiment. Firstly, we segmented the test MRIs (never used for training) using Sens.AI. Then we asked the experienced readers to assess the segmentations. There were just four options, ranging from “Very low quality, I would not use it to support diagnosis”, to “Very high-quality segmentation, I would definitely use it”. Readers evaluated the segmentations without knowing where they came from (blinded setting). Moreover, each reader scored each segmentation once. Disagreements are sure, right? Lastly, the visual assessment isn’t an easy task. Are jagged contours worse than the smooth ones? Shall we include more hyperintense tissue in the tumor region? Quite a number of open questions here (Fig. 5).

Figure 5 [6]
The final remarks on automated medical image analysis
This experiment allowed us to define the acceptance criteria (the percentage of all experts that would have used the automated segmentations), and seamlessly combine quantitative and qualitative metrics in a comprehensive analysis process. Interestingly, we exploited a similar approach to verify the quality of our training sets as well.
Evidently, AI helps us not only automate the most time-consuming tasks. Additionally, it can make us see beyond the visible by extracting features impossible to capture using only eyes. However, such tools must be verified to make them applicable in clinics, as their results affect the patient management chain. Therefore, having a decent deep model is a great initial step – the next ones include designing and implementing theoretical and experimental validation of the pivotal elements of the processing pipeline in a fully reproducible, quantifiable, and thorough way that is evidence-based.
This is the right way to go.
References
[1] Sarah J. Lewis et al: Artificial Intelligence in medical imaging practice: looking to the future, Journal of Medical Radiation Sciences, 2019, DOI: 10.1002/jmrs.369.
[2] https://www.ncbi.nlm.nih.gov/pmc/articles/PMC5244468/.
[3] https://academic.oup.com/neurosurgery/article/81/3/397/3806788.
[4] https://link.springer.com/article/10.1007/s11060-016-2312-9.
[5] https://www.sciencedirect.com/science/article/pii/S0730725X19300347.
[6] J. Nalepa et al: Fully-automated deep learning-powered system for DCE-MRI analysis of brain tumors. Artif. Intell. Medicine 102: 101769 (2020), https://www.sciencedirect.com/science/article/pii/S0933365718306638.
[7] K. Skogen et al: Diagnostic performance of texture analysis on MRI in grading cerebral gliomas, Eur J Radiol. 2016 Apr;85(4):824-9. doi: 10.1016/j.ejrad.2016.01.013. Epub 2016 Jan 21.
[8] J. Nalepa, M. Marcinkiewicz, M. Kawulok: Data Augmentation for Brain-Tumor Segmentation: A Review. Frontiers Comput. Neurosci. 13: 83 (2019), https://www.frontiersin.org/articles/10.3389/fncom.2019.00083/full.